When people talk about analytics jobs, they usually have a mental picture of a single job and skill set. They talk about analysts, or data analysts (in the Silicon Valley they may be called data scientists). However, we can structure the users of analytics tools by the kind of job they have. The builders of these tools must then have the same skills, but at a much deeper level.
The first job type is the office worker. Today, every employee is expected to be able to produce some analytics. The basic tools include the office suites from Microsoft, Google, or Apple. Proficiency in more specialized tools like Adobe Illustrator, InDesign, Acrobat, FileMaker, and Tableau are a plus. The worker is expected to be able to convert data between formats like CSV and Excel. Workers are typically given assignments like “Prepare a presentation explaining our performance and suggesting how it can be improved.” Therefore, office workers must be able to produce visualizations, where visualization refers to being able to produce graphics from tables using Adobe Illustrator, Microsoft Excel, and PowerPoint. By nature, the office workers are domain experts in their daily activities.
The second job type is that of a data analyst in a traditional company. The all-round data analyst must be proficient in a relational database system like MySQL, and in Excel. The analyst must also have a good understanding of descriptive statistics. A key skill is to be an expert in munging data across applications and file formats; this is also known as data shaping, wrangling, ETL, etc. The required statistical expertise is not deep, but basic A/B testing and Google Analytics experience are required. Presenting and selling the results of an analysis are very important, requiring the ability to be able to do basic data visualization in Excel and Tableau. The data analyst has to have a good understanding of the company’s products and general all-round skills.
The third job type is that of an analyst in a start-up company, where a typical assignment may sound like "please munge our data." This requires proficiency in the basic tools and the ability to move fast: go for the low-hanging fruits and be able to quickly implement a new analysis or visualization by writing Excel macros, Access programs, or R functions, which in turn requires a good knowledge of the available libraries in Excel, R, or Tableau. The data analyst in a start-up company must be proficient in the implementation of advanced parsers and creating ad hoc MySQL databases for persistent storage. Basic statistics knowledge, for example, contingency tables and Poisson tests, are also a must. Since a start-up does not have historical data, the analyst must be able to do the ground-truthing by themselves. As a lot of the data may come from social networks, this job type also requires the ability to use linguistics functions to clean up unstructured text and extract useful information.
An analyst in a data company has a completely different job. Here data is the product: “we are data — data is us.” This requires a formal background in mathematics, statistics, machine learning, or linguistics (natural language processing, NLP). The analyst must be able to discriminate among the various algorithms and understand their parameters. On the bright side, most data is already munged, but the analyst must be able to customize parsers and workflows. Understanding privacy laws is a must, especially the European ones because the internet has no borders, but the laws have and the fines can be debilitating. The analyst in a data company must have a good sense of emerging techniques, like topological data analysis.
The fifth job type is that of analysts in an enterprise, where they are members of an established data team with experts in various tools. By enterprise here we mean a reasonable sized non-data company who is data-driven, to distinguish it from the second job type. The work is about data, but data is often not central to the product. An example is the fourth industrial revolution, or industry 4.0. This analyst is a generalist with broad experience, a jack-of-all-trades. For survival, this analyst must be able to find blind spots where niche roles can be played. It requires heavy experience in munging and aggregating data from all possible sources: SQL and NoSQL, logs, IoT, social networks (Twitter, LinkedIn, Facebook, etc.), news feeds, REST services, data.gov, Google Public Data Explorer, etc.
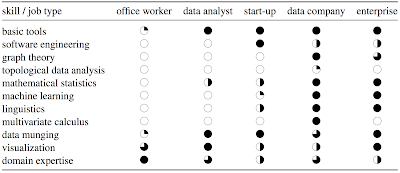
We can summarize these job types and the skills they require in this table:
This is a generalization and it can be debated. For example, graph theory is topology, actually the historical beginning of it, but topological data analysis focuses on point clouds to build graphs, while traditional graph theory uses completely different mathematical tools to analyze graphs which is why I listed them as two different items. One could also make this list summarizing skills:
- Tools of the trade: SQL, R, Java, Scala, Python, Spark, MapReduce, …
- Basic statistics: distributions, maximum likelihood estimation, statistical tests, regression, …
- Machine learning: k-nearest neighbors, random forests, …
- Linear algebra and multivariate calculus
- Data munging: imputation, parsing, formatting; aka wrangling, shaping
- Data visualization and communication: Tableau, ggplot, d3.js
- Software engineering: logging, performance analysis, REST interfaces, connectors, …
- Curiosity for emerging technologies, like algebraic topology
- Thinking like a data scientist: business sense, approximations, teamwork, …


No comments:
Post a Comment